
Controversial_Ideas , 6(2), 19; doi:10.63466/jci06020019
Article
Has DEI Increased the Representation of Women in Higher Education? A Time-Series Replication Analysis of the Impact of the UK Athena Swan Scheme
1
Department of Mathematics, King’s College London, Strand, London WC2R 2LS, UK
2
UCL Social Research Institute, University College London, 55–59 Gordon Square, London WC1H 0N, UK; alice.sullivan@ucl.ac.uk
*
Corresponding author: john.armstrong@kcl.ac.uk; Tel.: +44-20-7848-2855
How to cite: Armstrong, J.; Sullivan, A. Has DEI Increased the Representation of Women in Higher Education? A Time-Series Replication Analysis of the Impact of the UK Athena Swan Scheme. Journal of Controversial Ideas 2026, 6(2), 19; doi:10.63466/jci06020019.
Received: 15 November 2025 / Accepted: 16 June 2026 / Published: 10 November 2026
Abstract
:Athena Swan is an award scheme designed to recognise higher education institutions’ (HEIs’) commitment to advancing ‘gender equality’. This paper uses time-series analysis to conduct a replication analysis of the relationship between Athena Swan status and both the proportion of women in senior roles and change in the proportion of women in senior roles. A previous study, using essentially the same data set, found that ‘Athena SWAN members showed greater and faster growth in female representations’. We apply time-series analysis methods to show that effects found in this previous study can be explained by two factors: (1) changes in the set of institutions that hold Athena Swan awards; and (2) the fact that it is more challenging to improve levels of female representation when they are closer to 50%. Once we controlled for these factors, we did not find any impact of Athena Swan awards on changes in the number of women in senior positions over the time-period studied. We conducted a power analysis which places bounds on the maximum size of effects which we would be unable to detect. In addition, we find that institutions with a low proportion of women in senior positions are more likely to be members of Athena Swan and are more likely to hold an award.
Keywords:
Athena Swan; higher education; women; gender; replication analysis; DEI1. Background
Public and private sector organisations have made substantial investments in ‘Diversity, Equity and Inclusion’ (DEI) initiatives, known as ‘Equality, Diversity and Inclusion’ (EDI) in the UK. Strong claims have been made for the efficacy and importance of DEI initiatives, yet the evidence to support DEI initiatives is mixed and sometimes methodologically weak (Dobbin and Kalev, 2021; Kalev et al., 2006; Wang et al., 2024). The McKinsey consultancy’s claim to have demonstrated a link between diversity and financial performance has been particularly influential, yet a quasi-replication analysis debunked McKinsey’s studies, finding no statistically significant link between financial outperformance and executive racial/ethnic diversity (Green and Hand, 2024).
There are concerns that DEI initiatives can lead to undesirable consequences, including within the higher education sector. Some DEI staff, networks and initiatives have been associated with activities promoting harassment and restricting academic freedom (Hooven, 2023; Sullivan, 2025b). DEI has also been implicated in violating equality and anti-discrimination laws. According to an investigation reported in the New York Times, the University of Michigan spent a quarter of a billion dollars on DEI between 2016 and 2024. Yet survey data revealed that “students and faculty members reported a less positive campus climate than at the program’s start and less of a sense of belonging. Students were less likely to interact with people of a different race or religion or with different politics” (Confessore, 2024).
In politically contested fields, there is a danger that empirical claims are defended on political rather than empirical grounds. Trump’s anti-DEI mandate may have further entrenched tribal thinking on this issue. A recent paper in response to Trump’s mandate describes DEI as ‘lifesaving’ and asserts that “Because the research evidence is so strong and the findings are so consistent, scholars have spent very little time debating whether DEI strengthens American higher education. Many people with Ph.D. degrees from our nation’s top universities have repeatedly confirmed that it has, does, and will” (Harper, 2025). Yet such sweeping statements are unhelpful, and the claim that there has been little debate, if taken at face value, is hardly reassuring. A more nuanced response would ask what the costs and benefits are of any given DEI intervention, acknowledging that any specific intervention may be effective, ineffective, or damaging.
Internationally, there is little systematic quantitative time-series evidence assessing the effectiveness of DEI initiatives. Schemes certificating and rewarding institutional gender equality plans have proliferated despite a lack of sound research evidence (Tzanakou et al., 2021). The most prominent of these schemes is the Athena Swan scheme, which describes itself as “a framework which is used across the globe to support and transform gender equality within higher education (HE) and research”. One study (Xiao et al., 2020) has attempted to assess the impact of Athena Swan. Xiao et al. claim that participation in Athena Swan led to growth in female representation among award holders in the UK. The current paper challenges these findings.
Replicability is an important scientific principle. The ‘replication crisis’ refers to a pattern of scientists being unable to replicate published results (Nosek et al., 2022). Publication bias is a distinct phenomenon whereby certain results are more likely to be published than others. One example is that null results are notoriously difficult to publish (Stanley, 2005). Other biases can arise due to the preferences of gatekeepers such as reviewers and journal editors. Publication bias collides with the replication crisis when editors are reluctant to publish studies which fail to replicate findings published in their own journal (King, 2026).
The main body of the current paper was initially submitted to BMJ Open, as a response to Xiao et al. (2020). Following a lengthy review process, the reviewers all recommended acceptance. None of the reviewers disputed that we had shown that the paper by Xiao et al. was fundamentally flawed. We were therefore surprised that the paper was rejected by the managing editor, who was not an academic, apparently disregarding the reports of the expert reviewers. In an effort to investigate the reasons, we submitted a Subject Access Request (SAR), which is a legal right under the UK General Data Protection Regulation (UK GDPR) to ask any organisation if they are using or storing your personal data and to receive a copy of it. We learned that the editor’s “short answer” for why our paper was rejected was (regarding the lead author) “He’s quite argumentative and opinionated. Here’s his Twitter”. A fuller explanation from the editor stated “The author’s social media account also coloured our impression of the manuscript as the author is very outspoken on issues relating to EDI.”
At the time the editor made this comment (and forwarded a link to the lead author’s Twitter feed), his most recent posts had been to retweet Sex Matters (a gender-critical women’s rights organisation in the UK), FIRE (a US free-speech organisation), the London School of Economics (LSE) Academic Freedom network, and J.K. Rowling’s famous tweet in support of Maya Forstater, “Dress however you please. Call yourself whatever you like. Sleep with any consenting adult who’ll have you. Live your best life in peace and security. But force women out of their jobs for stating that sex is real? #IStandWithMaya #ThisIsNotADrill”.
The same method (SAR) was subsequently used to show that this was not the first incident whereby a scientific paper had been rejected by BMJ Open, apparently for political reasons. BMJ Open published a paper on transgender and non-binary adults in England, based on data from the 2021 GP Patient Survey (Saunders et al., 2023). The paper found that trans and non-binary adults were more likely to be from Asian, black, mixed or other ethnic groups and more likely to live in more deprived parts of the country. A sociologist, Michael Biggs, submitted a rapid response (Biggs, 2024a) pointing out that the patient survey identified the transgender population using the question ‘Is your gender identity the same as the sex you were registered at birth?’, taken from the 2021 Census of England and Wales, and that the results produced by this question were implausible. Biggs had demonstrated that people lacking English proficiency or educational qualifications were substantially overrepresented in the transgender population, according to the census, suggesting that they had simply been confused by the question. This in turn produced implausible results according to demography and geography, such as the finding that one in 67 Muslims was transgender (Biggs, 2024b). Biggs’s work was sufficiently irrefutable that it led to the gender-identity data from the 2021 Census being deaccredited as official statistics in 2024 (Sullivan, 2025a). Yet the implausible findings in the Saunders et al. paper were allowed to stand without rebuttal. We suggested to Biggs that he investigate using a SAR as we had done. BMJ Open staff emails revealed that they accused Biggs of being “offensive” and “transphobic” (Grove, 2024; Skidelsky, 2024).
If journals suppress findings either because they dislike the findings or the opinions of the author, this directly biases the literature. In cases where flawed papers cannot be critiqued or rebutted due to political bias, the error is compounded. Yet vulnerable and disadvantaged groups are among those most likely to be harmed by policy and practice which is based on inaccurate research findings.
2. Athena Swan
Athena Swan was established in 2005 with the goal of advancing the careers of women in STEMM (Science, Technology, Engineering, Mathematics and Medicine) subjects in higher education in the UK. Since then, it has expanded its remit beyond STEMM to cover all university staff, both academic and professional services. It has replaced its focus on women with a remit to address ‘gender’, including male under-representation and gender identity. It has also expanded internationally, to Ireland, India and Australia. Advance HE, the organisation which runs Athena Swan, also supports similar schemes in the US (SEA Change) and Canada (DIMENSIONS).
Participation in the Athena Swan scheme makes substantial demands on higher education institutions, including demands on staff time, with the burden often falling on female staff. As such, there is a clear policy need to understand whether Athena Swan has achieved measurable effects on female representation.
There has been persistent gender inequality in STEMM. For example, according to the 2018 Survey of Medical Clinical Academic Staffing Levels, less than 20% of clinical professors are women (Watson et al., 2018); the Institute of Physics (2022) report that in 2018, 12% of physics professors were women; and in 2017/18 11% of mathematics professors were female (RSS et al., 2022).
The Athena Scientific Women’s Academic Network (SWAN) charter was established in the UK in 2005 to promote gender equality in higher education institutions (HEIs) within STEMM disciplines. The negative societal impacts of limiting opportunities for women are well understood. By signing up to the Athena Swan Charter, institutions agree to address issues such as the gender pay gap, which exists not only in academic medicine (Dacre et al., 2020; O’Neill, 2019), but also across society in the UK and internationally (Blau and Kahn, 2020; Hoff, 2021; Joshi and Paci, 2001). The further negative impacts of gender inequality upon academic medicine have been reviewed (Joshi et al., 2021; Penny et al., 2014). The authors conclude that:
inequity in academic medicine matters because: (a) it is a waste of public investment due to a loss of research talent; (b) as a consequence, some areas of medicine are under-researched at a cost to patients and society; and, (c) discriminatory practices and unconscious bias continue to occur.
The Athena SWAN Charter was given a significant boost in 2011 when the National Institute for Health Research (NIHR) announced that from 2016 eligibility for funding would be contingent on institutions holding an Athena Swan Silver award (Donald et al., 2011), though this requirement was dropped in 2020 (NIHR, 2020). In 2015 the scope of the Athena SWAN charter was expanded beyond STEMM to cover all academic subjects and professional services. This means that the charter now applies to gender-balanced and female-dominated departments, rather than being focused on areas of female under-representation. The name of the charter was changed from Athena SWAN to Athena Swan in 2021 to reflect the fact that Athena Scientific Women’s Academic Network was no longer an accurate title. The charter has also expanded internationally, with the development of similar schemes in Australia, Ireland, Canada, India and the US. It is now compulsory for Irish HEIs to sign up to the Athena SWAN Ireland Charter and Irish funding bodies have made holding Athena Swan awards a condition of receiving funding (Colfer, 2023; Science Foundation Ireland, 2019).
The aim of the Athena Swan Charter is to recognise institutions’ and departments’ efforts to promote gender equality. This should be understood broadly as covering issues such as the pay gap, female representation in senior roles, the availability of flexible working arrangements and reducing sexual harassment. Institutions and departments must first commit to the charter principles, and they can then apply for Bronze, Silver and Gold awards. To obtain an award, the institution must submit a report on gender inequality within the institution and its plans to address it. This report is then judged by a panel, which decides whether the particular level of award is merited. It is important to note that award criteria focus on plans to improve rather than current levels of gender equality (Armstrong and Sullivan, 2025). Athena Swan rewards “commitment to advancing” women’s careers rather than the actual level of advancement achieved, and this is reflected in the award criteria (Advance HE, 2021, 2022).
Athena Swan now spans all university departments and has developed international reach and shown a tendency to expand. As such, higher education policymakers internationally, as well as individual higher education institutions, have an interest in understanding whether Athena Swan has quantifiable effects on female representation in higher education. Assessing the success of Athena Swan on its own terms does not imply a view on the goal of achieving equal representation of men and women across all academic and professional services departments, which would imply a desire to reduce the number of female staff in female-dominated departments, such as nursing and library services.
A previous paper (Xiao et al., 2020) claims that ‘Athena SWAN members showed greater and faster growth in female representations [sic].’ The question of whether these findings are valid is likely to be of wide interest within the higher education sector.
The current paper tests Xiao et al.’s findings and shows that they are not robust. Our reanalysis of the Higher Education Statistics Agency (HESA) data does not find any impact of Athena Swan awards on changes in the number of women in senior positions over the time-period studied. In addition, we find that institutions with a low proportion of women in senior positions are more likely to be members of Athena Swan and are more likely to hold an award.
Our study contributes to the growing body of evidence on the effectiveness of the Athena Swan programme by providing a longitudinal quantitative analysis. The need for such an analysis was identified in Ovseiko et al. (2020). A quantitative analysis of female employment in medical school data was performed by Gregory-Smith (2018), also using difference-in-differences tests. It did not find any impact that could be attributed with confidence to Athena Swan. The paper does not contain a power analysis, but as the analysis was restricted to medical schools it will have had lower power than the current study, and as a result the author only concluded that there was ‘not yet’ evidence for the effectiveness of Athena Swan. We perform a power analysis of our study using a Monte Carlo simulation.
There is also existing literature on Athena Swan based on qualitative research (focus groups, observations and interviews), quantitative analyses of subjective survey questions, and policy analysis. This literature has identified a number of consistent findings, some positive, some negative. Athena SWAN raises the profile of gender equality issues within organisations (Athena SWAN Charter Review Independent Steering Group, 2020; Caffrey et al., 2016; Munir et al., 2014; Tzanakou and Pearce, 2019); it improves staff members’ subjective ratings of how effectively the organisation is tackling gender inequality (Munir et al., 2014); and it has led to a variety of concrete initiatives to improve equality (Caffrey et al., 2016; Ovseiko et al., 2017). Conversely, completing Athena SWAN applications is time-consuming, with a disproportionate burden falling on female academics, and it can be perceived as a box-ticking exercise (Athena SWAN Charter Review Independent Steering Group, 2020; Bhopal and Henderson, 2021; Caffrey et al., 2016; Ovseiko et al., 2017; Tzanakou and Pearce, 2019); the process can produce perverse incentives to hide problems and go for quick wins, and can encourage tokenism (Ovseiko et al., 2017; Tzanakou and Pearce, 2019); and it may lead to other equalities issues such as race being neglected (Athena SWAN Charter Review Independent Steering Group, 2020; Bhopal and Henderson, 2021). A lack of quantitative evidence on the costs and benefits of the Athena Swan scheme has been noted by Murray et al. (2024), who also point out the lack of accessible, comprehensive data on scheme membership over time.
We have previously examined (Armstrong and Sullivan, 2025) Athena Swan as a case study of a ‘policy scoring scheme’: a programme whereby external parties score institutional policies according to their own criteria. This model was pioneered by the US Human Rights Campaign, which has run a Corporate Equality Index (CEI) since 2002, and subsequently adopted in the UK by the LGBTQ+ pressure group Stonewall with their Workplace Equality Index in 2005 (rebranded as ‘Proud Employers’ in 2025). We identified a number of risks to the policy scoring scheme model. The model effectively outsources organisational policy to an external body, meaning that the organisation is institutionally captured by that body. This exacerbates groupthink, a phenomenon where groups make sub-optimal decisions, prioritising consensus, harmony, and conformity over critical analysis (Janis, 1971). It makes it less likely that organisations will prioritise their activities in an effective way, as they instead focus on achieving a high ranking on a scheme whose criteria they do not determine.
3. Research Questions
In this study we focus on the question of whether the Athena Swan Charter has had a measurable impact on female representation in senior roles at an institutional level. We test the following hypotheses:
Hypothesis 1:
Athena Swan award holders show more rapid changes in female representation in senior roles (senior management and professors).
As discussed above, a previous study (Xiao et al., 2020) concluded that it had found evidence supporting this hypothesis. However, as we will explain in more detail later, the statistical approach employed in this study conflated changes over time in the make-up of the group of institutions which hold Athena Swan status with changes in the proportion of women in senior roles within institutions. Additionally, the analysis did not take account of the fact that gender equality occurs when the proportion of women is approximately 50% and so changes in equality of representation become harder to achieve as the proportion approaches 50%. The principal aim of our study is to re-examine essentially the same data but to apply the time-series methodology of difference-in-differences to correct for these flaws.
Hypothesis 2:
Institutions with lower proportions of women in senior roles are more likely to be Athena Swan members and to have higher levels of awards.
This hypothesis is motivated by the fact that Athena Swan awards are given to institutions on the basis of plans to improve rather than current levels of gender equality. It may therefore be easier for institutions to obtain an Athena Swan award if they have greater gender inequality either because they are more motivated to address the inequality or because it will be easier to find successful interventions to increase female representation when it is relatively low than when it is already high. This hypothesis is significant because, if true, it would call into question the use of Athena Swan awards as a basis for funding, as this would disadvantage institutions with high prior levels of female representation.
4. Methods
4.1. Data
4.1.1. Representation of Women in Senior Roles
Employment data on the number of women and men in senior positions in UK HEIs was obtained from HESA for the academic years 2012/13 through to 2018/19. These counts were obtained using HESA’s Gold Access data set ‘HESA Staff (excluding atypical) Full Person Equivalent (FPE) v1.’ A senior position was defined to be one with the Contract Level field equal to either Senior Management or Professor. Staff with a sex recorded as “Other” were excluded from the analysis. This data set was selected to be as close as possible to that used by the authors of a previous study (Xiao et al., 2020), who did not make their data available on request. We use one additional year of data because we are using the method of difference-in-differences and so require an extra year to compute the necessary differences. We requested a longer series of award data from Advance HE but, as the data set they provided did not include award dates for all institutions, it could not be used to extend the analysis over a longer time-period.
We removed four outlying data points as irregularities in the data suggested there may have been data entry errors at these points (corresponding to Goldsmiths College in 2012/13 and 2013/14, the University of St Andrews in 2012/13 and the University of Liverpool in 2013/14)1.
4.1.2. Athena Swan Awards
Historical data on institutional Athena Swan awards was obtained using Internet Archive snapshots of the Equality Challenge Unit’s webpage ‘Athena Swan Members’ (Equality Challenge Unit, 2016). The 2016 version of this webpage gives a mostly complete history of Athena Swan awards up to that year, and subsequent snapshots, together with the awards booklets linked from these pages, allow one to identify subsequent awards. Where there were gaps in the record, we consulted institutional websites to identify the award status. This data was copied manually into a single data file which was repeatedly checked until no data entry errors were identified for two complete passes through the data.
Awards were coded as either ‘Non-member’, ‘Non-recipient’, ‘Bronze’ or ‘Silver’. For each academic year, the award level chosen was the highest level held by the institution that year.
4.2. Analysis
Figure 1 shows the proportion of women in senior positions across the sector for each academic year according to Athena Swan status. For each academic year there is a line segment showing, on the left, the proportion of women in senior roles at the beginning of the academic year, and at the end of the academic year on the right.
Figure 1.
Proportion of women in senior roles by Athena Swan status.
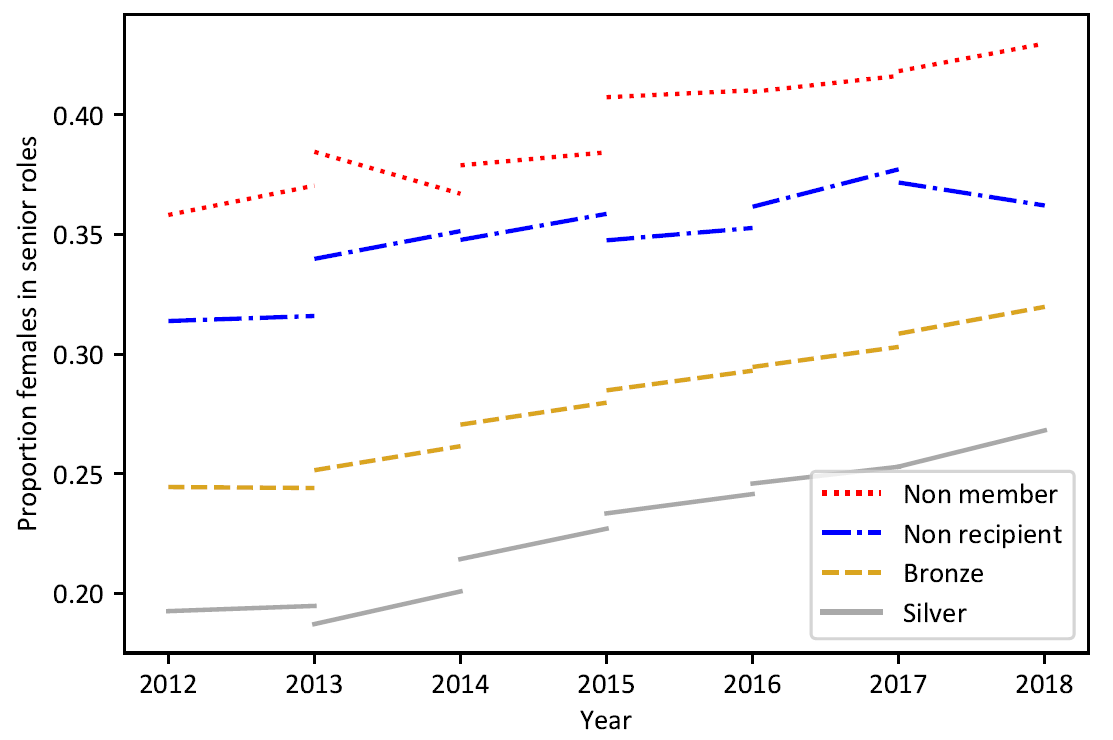
The gradient of each line segment gives an indication of how the proportion of women has changed within institutions over the year. As the set of institutions with a particular Athena Swan status changes each year, there are jumps in each series from one year to the next. If one naïvely regresses the proportion of women in senior roles at the beginning of each academic year against the year, then one’s analysis will conflate the effects of Athena Swan with the changes in the set of institutions holding Athena Swan awards. This was the approach taken in Xiao et al. (2020). Instead, we adopt a time-series analysis approach which allows us to model the change in the proportion of women each year within each institution in isolation.
Furthermore, one might expect that the rate of increase in the proportion of women in senior roles would decrease as one approaches gender equality and hence that the rate of increase will depend upon the proportion at the beginning of the year. Xiao et al. (2020) did not control for this effect. We control for this using auto-regressive models.
As well as fitting linear models, Xiao et al. reported a descriptive statistic that also appeared to suggest that Athena Swan had a positive effect upon the number of women in senior roles. They defined their own descriptive measure of the rate at which an institution moves towards gender equality which they call the rate growth. The rate growth associated with an Athena Swan status S is defined to equal:
where n is the number of years in the study and is the proportion of women in senior roles in institutions with status S in year i of the study. This measure does not take into account the fact that gender equality will occur when 50% of senior positions are held by women and so improvements in gender equality will likely be harder as one approaches the 50% level. In fact, the rate growth measure does quite the opposite of this as the denominator weights changes in female representation according to how close the current proportion is to 0% rather than 50%. As a result, if the summand in the definition is assumed to be a positive constant, presumably indicating a steady rate growth, then the proportion of women in senior roles must increase exponentially. This is, of course, unsustainable as the proportion must in fact remain between 0 and 1. As a result, Xiao et al.’s descriptive statistics overstate the impact of Athena Swan status. The coefficients obtained in our linear models provide a similar statistic that corrects for this.
4.2.1. Time-Series Analysis for Hypothesis 1
We have taken as our outcome variable the change in the proportion of women in senior positions at a given institution in a given year.
Let denote the proportion of women in senior positions in institution α in year i. We denote our outcome variable by Let denote the Athena Swan status of institution α in year i. We considered linear models of the form:
where aS and bS are values that may depend upon an institution’s Athena Swan status S and the are independent random increments with mean 0.
This model is a mean-reverting stochastic model. Since the change in is modelled as depending upon itself, it is termed an auto-regressive (AR) model. In the standard terminology of time-series modelling, this is essentially an AR(1) model (Hamilton, 2020) except that we will not assume the are Gaussian.
The trend in the average value can be seen by setting . One can solve the resulting difference equations to see that the expected proportion of women in senior roles will tend exponentially slowly towards a long-term mean. The number of years required for the expected proportion to move halfway towards its long-term mean is
the approximation being valid for small values of aS. The parameter controls the long-term average level. If is equal to zero, then this long-term average will be 0.5. More generally, the difference between this long-term average and 0.5 is equal to
We label our models using the abbreviations (aS = 0, aS = a and aS = ∗) to indicate whether aS is identically 0, equal to a fixed constant or allowed to vary. We use similar labels for the parameter bS.
We do not explicitly constrain to lie between 0 and 1 so the model is an approximation. For our model to be reasonable, we require 1 > aS > 0 to ensure both that the model tends to a long-term mean and the proportions remain positive.
The model (aS = a, bs = 0) is our basic null model: it represents a situation where all institutions are moving to long-term gender equality at the same rate. The model (aS = ∗, bs = 0) represents a situation where all institutions are moving to long-term gender equality but at rates dependent on Athena Swan status. The model (aS = a, bs = ∗) represents a situation where all institutions are moving at the same rate but to different long-term levels. The model (aS = ∗, bs = ∗) allows both the rate and the level to vary.
It is not reasonable to assume that the random increments are identically distributed. This is because larger institutions can expect lower fluctuations in the proportion of women in senior roles each year because of the “diversification” effect due to their size. We assumed that our increments are given in the form
where the rescaled increments are assumed to be independent and identically distributed and follow a Student’s t-distribution. See Appendix A for more detail.
4.2.2. Analysis for Hypothesis 2
To test Hypothesis 2 we considered only the data from the academic year 2012/13. We order the possible Athena Swan statuses of an institution as ‘Non-member’, ‘Non-recipient’, ‘Bronze’, or ‘Silver’ and then perform an ordinal logistic regression using the proportional odds model with the proportion of women employed in senior positions by an institution as the explanatory variable.
5. Results
The only model in which any of the effects of Athena Swan were significant at a P-value less than 5% was model (aS = 0, bs = ∗), but once we controlled for the prior proportion of women (model (aS = a, bs = ∗)) these effects vanished, leading us to prefer the null model (aS = a, bs = 0). The single coefficient in this model is significant with a P-value less than 0.01%. Therefore, we preferred this model over any of the alternative models which indicated some impact of Athena Swan, and over the models with aS = 0.
The additional coefficient of the remaining model (aS = a, bs = b) was not significant, so our final model selection was the null model (aS = a, bs = 0). As we would hope, the condition 0 < a < 1 holds and so our interpretation of this model as indicating a long-term tendency to a mean proportion of 0.5 women in management holds.
In the discussion above, the decisions about which models we preferred were based upon the significance values of the coefficients in the regressions: we reject models with insignificant coefficients or where apparent associations disappear when one adds additional controls. Alternatively, we could have used the Akaike Information Criterion (AIC) as a basis for model selection: it yields the same result.
We performed our analysis both when the Athena Swan status was taken to have four possible values (non-member, non-recipient, Bronze, Silver) and when the Athena Swan status was taken to have two possible values (member, non-member). When using four statuses, we took the Bronze status as our baseline for comparisons and significance tests. The null model (aS = a, bs = 0) was preferred in both of these analyses with the same justification for choosing between models.
In Table 1 we have shown the estimated coefficients and significance levels for seven of the nine possible models when we consider two statuses, member and non-member. The two omitted models have aS = 0 and can clearly be rejected in favour of our null model.

Table 1.
Coefficient estimates when considering two Athena Swan statuses, member and non-member. Asterisks denote significance boundaries * p < 0.05, ** p < 0.01, *** p < 0.001.
Table 1.
Coefficient estimates when considering two Athena Swan statuses, member and non-member. Asterisks denote significance boundaries * p < 0.05, ** p < 0.01, *** p < 0.001.
| Model | Coefficient | Estimate | Std-Error | p-Value | |
|---|---|---|---|---|---|
| (aS = 0, bs = ∗) | bMember | 0.0083 | 0.0006 | 0.0000 | *** |
| AIC: 185.0 | bNonMember − bMember | −0.0054 | 0.0021 | 0.0108 | * |
| (aS = a, bs = 0) AIC: 171.9 | a | 0.0351 | 0.0026 | 0.0000 | *** |
| (aS = a, bs = b) | a | 0.0313 | 0.0075 | 0.0000 | *** |
| AIC: 173.6 | b | 0.0009 | 0.0017 | 0.5900 | |
| (aS = a, bs = ∗) | a | 0.0282 | 0.0081 | 0.0005 | ** |
| AIC: 174.6 | bMember | 0.0018 | 0.0019 | 0.3459 | |
| bNonMember − bMember | −0.0024 | 0.0023 | 0.2990 | ||
| (aS = ∗, bs = 0) | aMember | 0.0351 | 0.0027 | 0.0000 | *** |
| AIC: 173.9 | aNonMember − aMember | −0.0022 | 0.0128 | 0.8611 | |
| (aS = ∗, bs = b) | aMember | 0.0313 | 0.0075 | 0.0000 | *** |
| AIC: 175.6 | aNonMember − aMember | −0.0029 | 0.0128 | 0.8221 | |
| b | 0.0010 | 0.0017 | 0.5774 | ||
| (aS = ∗, bs = ∗) | aMember | 0.0247 | 0.0090 | 0.0060 | ** |
| AIC: 175.7 | aNonMember − aMember | 0.0200 | 0.0206 | 0.3331 | |
| bMember | 0.0026 | 0.0021 | 0.2172 | ||
| bNonMember − bMember | −0.0052 | 0.0037 | 0.1607 |
In Table 2 we have shown the estimated parameters for the model (aS = ∗, bs = 0) when considering four possible Athena Swan statuses. As the coefficients indicate, the difference in the rate of movement towards gender equality between different Athena Swan statuses is marginal when compared to the overall rate of movement, and this difference is not statistically significant.
Table 2.
Example coefficient estimates when considering four Athena Swan statuses. Asterisks denote significance boundaries * p < 0.05, ** p < 0.01, *** p < 0.001.
Table 2.
Example coefficient estimates when considering four Athena Swan statuses. Asterisks denote significance boundaries * p < 0.05, ** p < 0.01, *** p < 0.001.
| Model | Coefficient | Estimate | Std-Error | p-Value | |
|---|---|---|---|---|---|
| (aS = ∗, bs = 0) | aBronze | 0.0346 | 0.0033 | 0.0000 | *** |
| aNonMember − aBronze | −0.0017 | 0.0129 | 0.8953 | ||
| aNonRecipient − aBronze | 0.0010 | 0.0115 | 0.9282 | ||
| aSilver − aBronze | 0.0017 | 0.0061 | 0.7810 |
As a sanity and robustness check, we repeated our analysis with slightly more naïve models. We repeated the analysis under the assumption that the increments are identically distributed, and under the assumption that the increments are normally distributed. The null model (aS = a, bs = 0) was still preferred in each case.
Since the null model was always preferred, we reject Hypothesis 1, that Athena Swan award levels correspond to improving proportions of women in leadership positions.
Our final model, (aS = a, bs = 0), only gives a value of 0.15 for the adjusted R-squared statistic and so it has limited explanatory power. This may simply be because of the inherent variability that occurs in hiring decisions over a short time-horizon, but it may be possible to find a model which explains more of the variance by including more explanatory factors, as outlined in the discussion section below. We have not explored these possibilities in this paper, as our interest is in the impact of Athena Swan.
The outcome of the ordinal logistic regression to test Hypothesis 2 performed using the polr function in R is shown in Table 3. We used the Brant test to validate the proportional odds assumption (Brant, 1990). The results show a significant inverse relationship between the ordered Athena Swan status and the proportion of women in senior positions. However, the difference between Bronze-award holders and Silver-award holders is not statistically significant. Thus, the evidence suggests that we should accept the modified hypothesis that both Athena Swan membership and holding an Athena Swan award are more likely for institutions with low proportions of women in senior positions.
Table 3.
Coefficient estimates of the ordinal logistic regression with Athena Swan status in 2012/13 as the outcome variable and proportion of women in 2012/13 as the explanatory variable. Asterisks denote significance boundaries * p < 0.05, ** p < 0.01, *** p < 0.001.
Table 3.
Coefficient estimates of the ordinal logistic regression with Athena Swan status in 2012/13 as the outcome variable and proportion of women in 2012/13 as the explanatory variable. Asterisks denote significance boundaries * p < 0.05, ** p < 0.01, *** p < 0.001.
| Coefficient | Estimate | Std-Error | p-Value | |
|---|---|---|---|---|
| Proportion Women | −10.37 | 1.82 | 0.0000 | *** |
| Non Member->Member | −3.60 | 0.62 | 0.0000 | *** |
| Member->Bronze | −2.66 | 0.59 | 0.0000 | *** |
| Bronze->Silver | 0.74 | 0.70 | 0.2896 |
6. Power Analysis
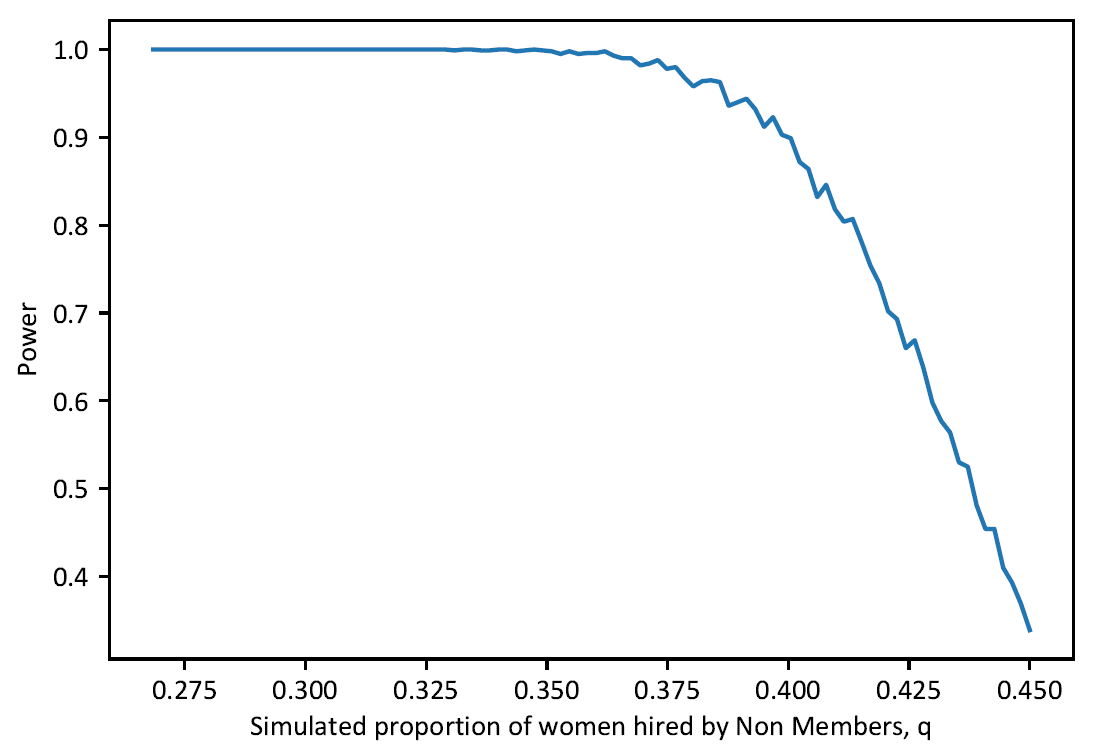
To estimate the statistical power of our method we used a Monte Carlo simulation. We performed 1,000 simulations of the changes in male and female representation in senior roles in each institution and calculated the proportion of times in which our methodology found a statistically significant impact of Athena Swan. This proportion estimates the statistical power of our analysis.
In each simulation we assumed that the initial proportion of women in senior roles matched the 2012/13 data as did Athena Swan membership. We then simulated data for subsequent years by assuming that each senior staff member had an independent 5% probability of being replaced each year. The sex of the replacement was then chosen using independent Bernoulli trials with the probability of a woman being chosen equal to 0.5 for Athena Swan members and a constant, q, for non-members. Athena Swan membership remained fixed throughout the simulation.
The statistical test we performed for each simulation was a linear regression based on the model (aS = ∗, bs = ∗) with two states, member and non-member. We checked for each simulation whether the variation in the coefficient bs was significant at the 5% level.
We only used institutions in our simulation if they provided data to HESA for each year of our study; thus, the sample size for our simulation was slightly smaller than that used in our analysis. In our simulations we only performed one of the statistical tests used in our study. We have therefore tried to err on the side of under-estimating the power.
The estimated power of our approach is plotted against the value of q in Figure 2. In 2012 approximately 27% of senior positions across the sector were held by women, and the corresponding value q = 0.27 is shown on the left of our chart. A power greater than 0.8 is often considered a reasonable level in experimental design, so our analysis would seem to have sufficient power to detect a priori plausible differences between member and non-member institutions.
Figure 2.
Estimated statistical power based on Monte Carlo simulations.
7. Discussion
There is wide interest in promoting greater equality within higher education, including promoting opportunities for women where they are an under-represented group. As such, the higher education sector has an interest in identifying effective interventions to achieve parity between the sexes. It is vital that the evidence base for adopting any given programme is robust, given the costs of participation, including staff time. As well as direct costs, one needs to consider the opportunity cost for institutions of participation in an external scheme such as Athena Swan, as this may lead to other opportunities for more effective interventions being missed. The need for robust evidence on Athena Swan is particularly pressing given the expansion of the scheme both within institutions and internationally, including, in the case of Ireland, making Athena Swan compulsory for higher education institutions to be eligible for competitive government research funding.
Our analysis shows that levels of female representation in senior roles are increasing across the higher education sector, but we did not identify any specific effect of Athena Swan status at an institutional level. Thus, we find no evidence that the increase in female representation can be attributed to Athena Swan. There may be small effects which our study is unable to detect, but our power analysis bounds their size. We also find that institutions with greater gender inequality are more likely to be Athena Swan members and are more likely to hold an award. This should not be seen as surprising given the nature of the awards, which reward plans for improvement, rather than actual attainment on any measure. Nevertheless, this feature of our results may seem counterintuitive to policymakers who may have assumed that achievement of a higher Athena Swan award would be associated with higher levels of gender parity.
It is likely that many end users of Athena Swan awards, specifically staff members, potential staff members and funders, have misunderstood the nature of Athena Swan awards. They may incorrectly believe that Athena Swan awards are given to institutions with greater gender equality. For example, Science Foundation Ireland describe Athena Swan Ireland as ‘a quality mark’ (Science Foundation Ireland, 2019) and the Open University refer to it as a benchmarking activity (The Open University, 2022). Our results show that this would be a major misunderstanding as Athena Swan status is in fact inversely correlated with gender equality.
Our findings suggest that institutional participation in the Athena Swan charter cannot be justified on the expectation of readily measured changes in the number of women in senior roles within a given institution.
Institutions with greater gender inequality are more likely to be Athena Swan members and are more likely to hold an award. This suggests it may be inappropriate to make funding decisions contingent upon obtaining an Athena Swan award. Indeed, it was already observed in Munir et al. (2014) that “the link between Athena SWAN and research funding is a controversial issue particularly because Athena SWAN is not a standard-based award” and they recommended that this tension should be addressed.
We acknowledge that there are limitations to our analysis. The effects of Athena Swan on the proportion of women in senior roles may not be visible in our study: if they are too small for the statistical power of the study; if they occur with a large lag; or if Athena Swan has resulted in sector-level changes rather than changes within institutions. The explanatory power of our model might be improved by considering factors such as: the proportion of women in the institution as a whole; the financial status of the institution; its areas of specialisation; historical moving average proportions of the number of women. It is conceivable that the effects of Athena Swan may only emerge in a richer model. Further, participation in Athena Swan may have generated qualitative and/or localised benefits in particular university departments, and these are outside the scope of our analysis.
These findings should be taken on board internationally by countries considering participation in Athena Swan or considering making this participation compulsory or a requirement for research funding. The findings should also be considered by UK HEIs in weighing the costs and benefits of participation, alongside the many other factors that should be considered in addressing gender inequality.
Author Contributions
Methodology, J.A.; Formal Analysis, J.A.; Writing J.A. and A.S.
Funding
Alice Sullivan is a member of the Centre for Longitudinal Studies, an Economic and Social Research Council resource centre funded by grant ES/M001660/1.
Data Availability Statement
Data on female representation at HEIs is available from HESA. Gold access is required for the fully accurate data we used; Silver access can be used to obtain counts rounded to the nearest 5. The data on the proportions of women used in this article cannot be shared publicly but can be obtained from HESA directly. The data on the Athena Swan status of institutions is available in the online supplementary materials alongside the R code used for the main analyses and the Python code used for the power analysis.
Ethics Approval Statement
Not applicable. Secondary data analysis of institutional data.
Conflicts of Interest
The authors declare no conflict of interest. The funders had no role in the design of the study; in the collection, analyses, or interpretation of data; in the writing of the manuscript, or in the decision to publish the results.
Appendix A. Modelling the Noise Term
We assumed that the random increments are given by
where the are identically distributed. The motivation for this scaling behaviour comes from the standard scaling properties of the variance of independent increments. If one adds N independent random increments each with standard deviation σ then the total increment will have standard deviation Our proposal for the scaling can be justified by assuming that changes in the number of women and in the number of men both occur due to independent random events of a given magnitude and that the number of such events is proportional to . Our proposed scaling then comes from the fact that we are modelling a change in the proportion of women rather than the change in absolute numbers.
Figure A1.
Log-log plot of the standard deviation of changes in proportion of women, σb, against mean number of staff nb for data bucketed by nb.
Figure A1.
Log-log plot of the standard deviation of changes in proportion of women, σb, against mean number of staff nb for data bucketed by nb.
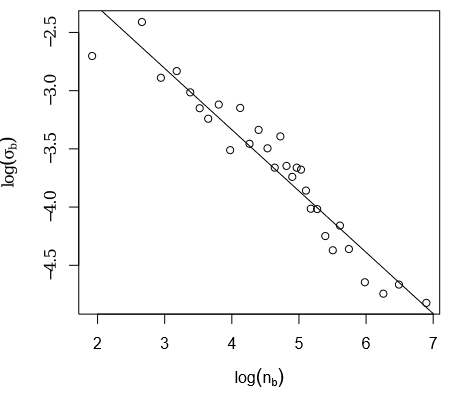
To validate this modelling decision, we clustered our data set into 30 equally sized buckets ordered by the number of senior staff in each institution and generated a log-log plot of the average number of senior staff in each bucket nb against σb, the standard deviation of in that bucket. Figure A1 shows a scatter plot on a log-log scale of σb against nb. Our scaling assumption suggests that this scatter plot should be reasonably well approximated by a straight line with gradient −0.5. We have plotted the least squares line of best fit in Figure A1 and it has a gradient of −0.527 in accordance with our assumption.
If we rewrite our linear model as
we can then estimate the model using standard linear modelling tools that assume identically distributed increments.
Q-Q plots of the residuals from our models indicated that the rescaled increments had considerably fatter tails than a normal distribution, so we assumed that these increments followed a Student’s t-distribution and estimated our model using the R package heavy (Osorio, 2019). A fat-tailed distribution of changes in the proportion of women each year might be explained by the changes resulting from a mixture of two or more processes such as regular hiring of staff and occasional major institutional changes such as redundancies and mergers.
References
- Advance HE. Transformed UK Athena Swan Charter: Information pack for departments. 2021. link to the article.
- Advance HE. Athena swan charter. 2022. link to the article.
- Armstrong, J.; Sullivan, A. A critical analysis of Athena Swan as a policy-scoring scheme. British Educational Research Journal 2025, 51(1), 225–43. [Google Scholar] [CrossRef]
- Athena SWAN Charter Review Independent Steering Group. The future of athena swan. 2020. link to the article.
- Bhopal, K.; Henderson, H. Competing inequalities: Gender versus race in higher education institutions in the UK. Educational Review 2021, 73(2), 153–69. [Google Scholar] [CrossRef]
- Biggs, M. Does the GP patient survey correctly identify trans and non-binary adults? Committee for Academic Freedom, 2024a; link to the article.
- Biggs, M. Gender identity in the 2021 census of england and wales: How a flawed question created spurious data. Sociology 2024b, 58(6), 1305–23. [Google Scholar] [CrossRef]
- Blau, F. D.; Kahn, L. M. The gender pay gap: Have women gone as far as they can? In Inequality in the United States; Routledge, 2020; pp. 345–62. [Google Scholar]
- Brant, R. Assessing proportionality in the proportional odds model for ordinal logistic regression. Biometrics 1990, 46(4), 1171–78. [Google Scholar] [CrossRef]
- Caffrey, L.; Wyatt, D.; Fudge, N.; Mattingley, H.; Williamson, C.; McKevitt, C. Gender equity programmes in academic medicine: A realist evaluation approach to Athena SWAN processes. BMJ Open 2016, 6(9), e012090. [Google Scholar] [CrossRef] [PubMed]
- Colfer, C. An athena swan song. The Critic. 2023. link to the article.
- Confessore, N. The university of michigan doubled down on dei: What went wrong? The New York Times Magazine, 16 October 2024. [Google Scholar]
- Dacre, J.; Woodhams, C.; Atkinson, C.; Laliotis, I.; Williams, M.; Blanden, J.; Wild, S.; Brown, D. Mend the gap: The independent review into gender pay gaps in medicine in England; 2020. link to the article.
- Dobbin, F.; Kalev, A. The civil rights revolution at work: What went wrong. Annual Review of Sociology 2021, 47(1), 281–303. [Google Scholar] [CrossRef]
- Donald, A.; Harvey, P. H.; McLean, A. R. Bridging the gender gap in UK science. Nature 2011, 478(7367), 36. [Google Scholar] [CrossRef] [PubMed]
- Equality Challenge Unit. Athena swan results. 2016. link to the article.
- Green, J.; Hand, J. R. McKinsey’s diversity matters/delivers/wins results revisited. Econ Journal Watch 2024, 21(1), 5–34. [Google Scholar]
- Gregory-Smith, I. Positive action towards gender equality: Evidence from the Athena SWAN charter in UK medical schools. British Journal of Industrial Relations 2018, 56(3), 463–83. [Google Scholar] [CrossRef]
- Grove, J. Gender-critical scholars claim discrimination over BMJ rejections; Times Higher Education, 2024. [Google Scholar]
- Hamilton, J. D. Time series analysis; Princeton University Press, 2020. [Google Scholar]
- Harper, S. Leveraging research and demanding proof in response to legislative attacks on DEI in US higher education. AERA Open 2025, 11, 23328584251355514. [Google Scholar]
- Hoff, T. The gender pay gap in medicine: A systematic review. Health Care Management Review 2021, 46(3), E37–E49. [Google Scholar] [CrossRef] [PubMed]
- Hooven, C. K. Academic freedom is social justice: Sex, gender, and cancel culture on campus. Archives of Sexual Behavior 2023, 52(1), 35–41. [Google Scholar] [CrossRef] [PubMed]
- Institute of Physics. Written evidence submitted by the Institute of Physics (IOP). 2022. link to the article.
- Janis, I. L. Groupthink; Psychology Today Magazine, 1971. [Google Scholar]
- Joshi, H.; Bryson, A.; Wilkinson, D.; Ward, K. The gender gap in wages over the life course: Evidence from a British cohort born in 1958. Gender, Work & Organization 2021, 28(1), 397–415. [Google Scholar] [CrossRef]
- Joshi, H.; Paci, P. Unequal pay for women and men: Evidence from the British birth cohort studies; MIT Press, 2001. [Google Scholar]
- Kalev, A.; Dobbin, F.; Kelly, E. Best practices or best guesses? Assessing the efficacy of corporate affirmative action and diversity policies. American Sociological Review 2006, 71(4), 589–617. [Google Scholar] [CrossRef]
- King, A. A. Trust the science? In this flawed system? Significance 2026, 23(3), 41–43. [Google Scholar]
- Munir, F.; Mason, C.; McDermott, H.; Morris, J.; Bagilhole, B.; Nevill, M. Advancing women’s careers in science, technology, engineering, mathematics and medicine: Evaluating the effectiveness and impact of the Athena SWAN Charter. 2014. link to the article.
- Murray, K.; Hunter Blackburn, L.; Mackenzie, L. Taking stock of Athena Swan: What value does it add and who decides? 2024. link to the article.
- NIHR. NIHR responds to the government’s call for further reduction in bureaucracy with new measures. 2020. link to the article.
- Nosek, B. A.; Hardwicke, T. E.; Moshontz, H.; Allard, A.; Corker, K. S.; Dreber, A.; Fidler, F.; Hilgard, J.; Struhl, M. K.; Nuijten, M. B.; Rohrer, J. M.; Romero, F.; Scheel, A. M.; Scherer, L. D.; Schönbrodt, F. D.; Vazire, S. Replicability, robustness, and reproducibility in psychological science. Annual Review of Psychology 2022, 73, 719–48. [Google Scholar] [CrossRef] [PubMed]
- O’Neill, S. Gender pay gap widens for UK scientists and engineers; New Scientist, 2019; link to the article.
- Osorio, F. Heavy: Robust estimation using heavy-tailed distributions. 2019. link to the article.
- Ovseiko, P. V.; Chapple, A.; Edmunds, L. D.; Ziebland, S. Advancing gender equality through the Athena SWAN Charter for Women in Science: An exploratory study of women’s and men’s perceptions. Health Research Policy and Systems 2017, 15(1), 1–13. [Google Scholar] [CrossRef] [PubMed]
- Ovseiko, P. V.; Taylor, M.; Gilligan, R. E.; Birks, J.; Elhussein, L.; Rogers, M.; Tesanovic, S.; Hernandez, J.; Wells, G.; Greenhalgh, T.; Buchan, A. M. Effect of athena SWAN funding incentives on women’s research leadership. BMJ 2020, 371. [Google Scholar] [CrossRef] [PubMed]
- Penny, M.; Jeffries, R.; Grant, J.; Davies, S. C. Women and academic medicine: A review of the evidence on female representation. Journal of the Royal Society of Medicine 2014, 107(7), 259–63. [Google Scholar] [CrossRef] [PubMed]
- RSS; IMA; LMS. Written evidence submitted by The Royal Statistical Society, The Institute of Mathematics and its applications and the london mathematical society committee for women and diversity in mathematics. 2022. link to the article.
- Saunders, C. L.; Berner, A.; Lund, J.; Mason, A. M.; Oakes-Monger, T.; Roberts, M.; Smith, J.; Duschinsky, R. Demographic characteristics, long-term health conditions and healthcare experiences of 6333 trans and non-binary adults in England: Nationally representative evidence from the 2021 GP patient survey. BMJ Open 2023, 13(2), e068099. [Google Scholar] [CrossRef] [PubMed]
- Science Foundation Ireland. Irish funding bodies to require athena SWAN gender equality accreditation for higher education institutions to be eligible for research funding. 2019. link to the article.
- Skidelsky, E. British Medical Journal Open refuses to publish comment by “transphobic” academic. 2024. link to the article.
- Stanley, T. D. Beyond publication bias. Journal of Economic Surveys 2005, 19(3), 309–45. [Google Scholar] [CrossRef]
- Sullivan, A. Review of data, statistics and research on sex and gender: Report 1. 2025a. link to the article.
- Sullivan, A. Review of data, statistics and research on sex and gender: Report 2: Barriers to research on sex and gender. 2025b. link to the article.
- The Open University. Charter marks. 2022. link to the article.
- Tzanakou, C.; Clayton-Hathway, K.; Humbert, A. L. Certifying gender equality in research: Lessons learnt from athena swan and total e-quality award schemes. Frontiers in Sociology 2021, 6, 784446. [Google Scholar] [CrossRef] [PubMed]
- Tzanakou, C.; Pearce, R. Moderate feminism within or against the neoliberal university? The example of Athena SWAN. Gender, Work & Organization 2019, 26(8), 1191–211. [Google Scholar] [CrossRef]
- Wang, M. L.; Gomes, A.; Rosa, M.; Copeland, P.; Santana, V. J. A systematic review of diversity, equity, and inclusion and antiracism training studies: Findings and future directions. Translational Behavioral Medicine 2024, 14(3), 156–71. [Google Scholar] [CrossRef] [PubMed]
- Watson, N.; Tang, P.; Knight, E. Survey of medical clinical academic staffing levels 2018. 2018. link to the article.
- Xiao, Y.; Pinkney, E.; Au, T. K. F.; Yip, P. S. F. Athena SWAN and gender diversity: A UK-based retrospective cohort study. BMJ Open 2020, 10(2), e032915. [Google Scholar] [CrossRef] [PubMed]
| 1 | Removing extreme values which are suspected to be errors is standard practice in data analysis. To identify outlying data points, we computed a scaled change in female representation which we defined to equal the change in female representation in senior roles each year divided by a scale factor of the square root of the number of people in senior roles in the institution. Smaller institutions will experience greater variability in the proportion of female representation and the scaling accounts for this, as explained in Appendix A. We then generated a Q-Q plot of this scaled change which identified four clear outlying data points. |
© 2026 Copyright by the authors. This article is an open access article distributed under the terms and conditions of the Creative Commons Attribution (CC BY) license (https://creativecommons.org/licenses/by/4.0/).
